Google Analytics Basics for Schools, Camps and Nonprofits
We connect all the websites we build to Google Analytics (GA). GA is a free resource that can give you a wealth of knowledge about your website traffic and performance. It is an overwhelming amount of data which can be scary if you don’t have an idea of what to look for and where to find it. In this blog post, we’ll dig into how you can use Google Analytics for schools, enrichments programs, camps and nonprofits.
Schools often use Google Analytics to learn a lot about their website performance, including:
- The demographics and locations of people coming to your site
- How visitors are finding you: what websites are sending traffic to your site
- What content on your website is most popular
- What kind of device visitors are using when viewing your site
- How much time people are spending on your website
- When and where users are exiting your site
Here are some basic steps for using Google Analytics and learning some important information about your website traffic.
Connect GA to your school, camp or nonprofit website
If you don’t already have a Google Analytics account, go to https://analytics.google.com/analytics/ and create an account. Add your website to Google Analytics, following the steps here.
Once you have the code, you can add it manually to your website by following Google’s instructions here. If your website is made with WordPress, you can also use a plugin to connect your website to your GA account. These plugins will show you some basic website traffic in your WordPress Dashboard, so you don’t even need to use the more complex GA Dashboard if you just want basic overview.
You can also add others to your GA account. We show you how to add users here.
WordPress Plugins
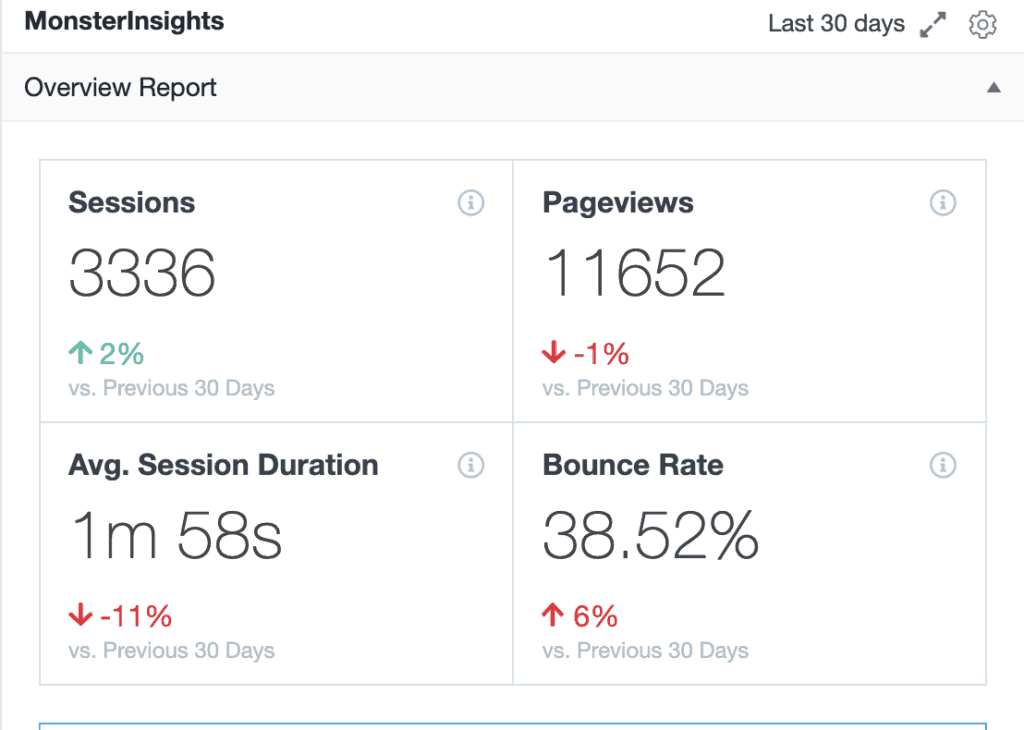
We have been using Monster Insights, a free basic plugin with a Premium version, for a few years. The free version shows the number of sessions, pageviews, duration and bounce rate for the past 30 days, compared to the previous period.
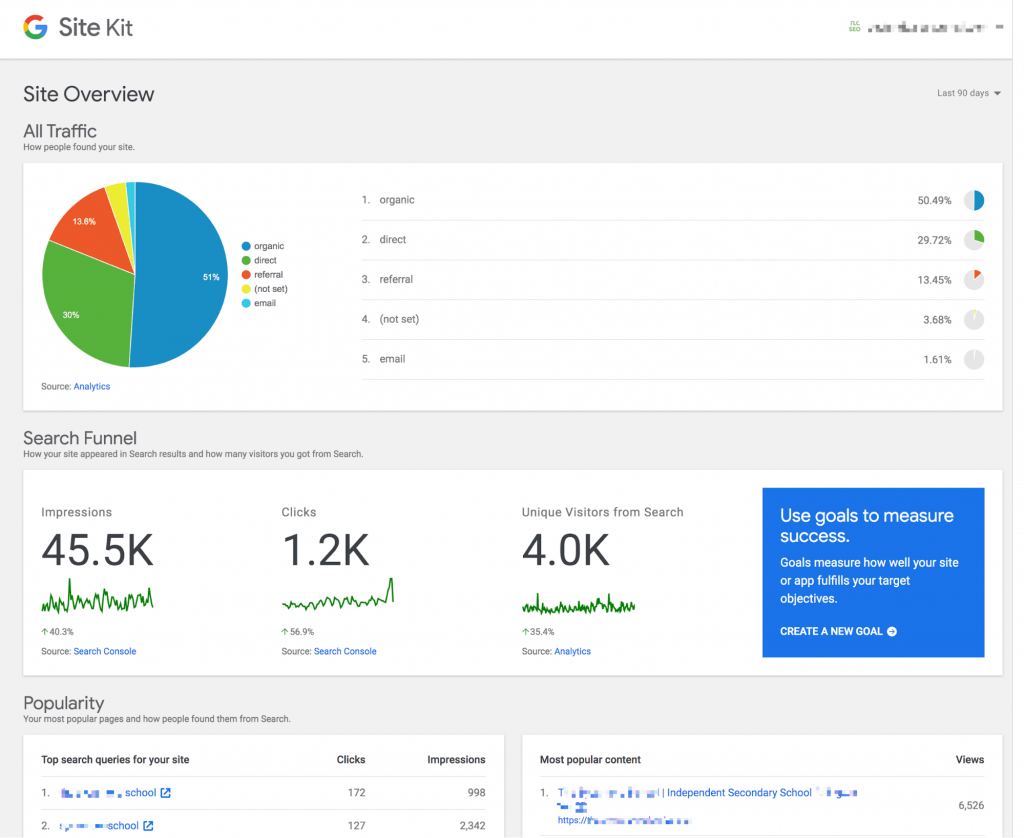
Google recently released its own free WordPress plugin called Site Kit, which looks promising as well. It also connects to Google Search Console, Google Ads and Page Speed Insights. This new plugin offers more information in a very clean, graphic format, including sources of traffic, impressions, clicks, and unique visitors. It also shows your most popular content and pages on your site. You can check stats for a number of time periods, up to 90 days.
Google Analytics Dashboard
If you are not using a WordPress plugin and/or you want more information about your website traffic, the Google Analytics platform has more information than you could dream up! Following are the top reports we recommend monitoring in Google Analytics for your school, educational or nonprofit organization.
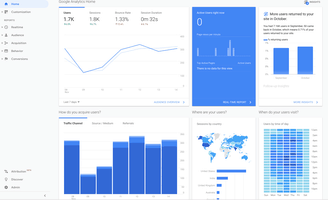
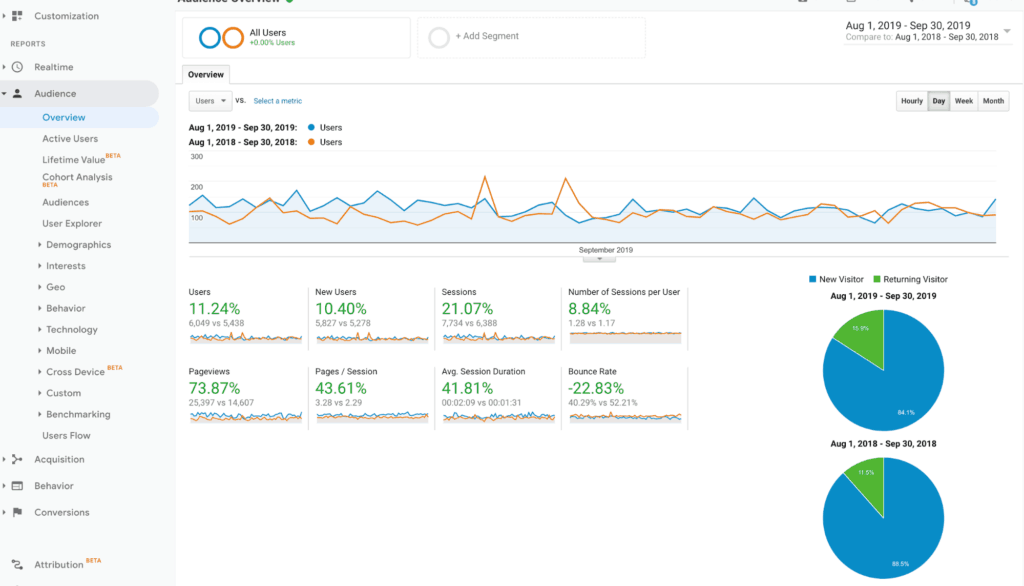
The Home Page of the Dashboard gives you a quick overview of your website’s recent performance. You can also see how many people are on your site at that exact moment.
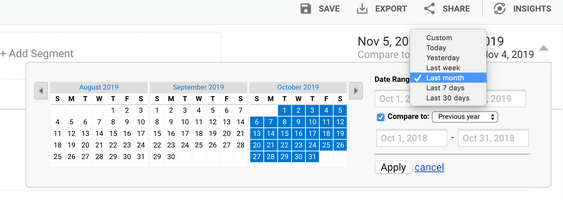
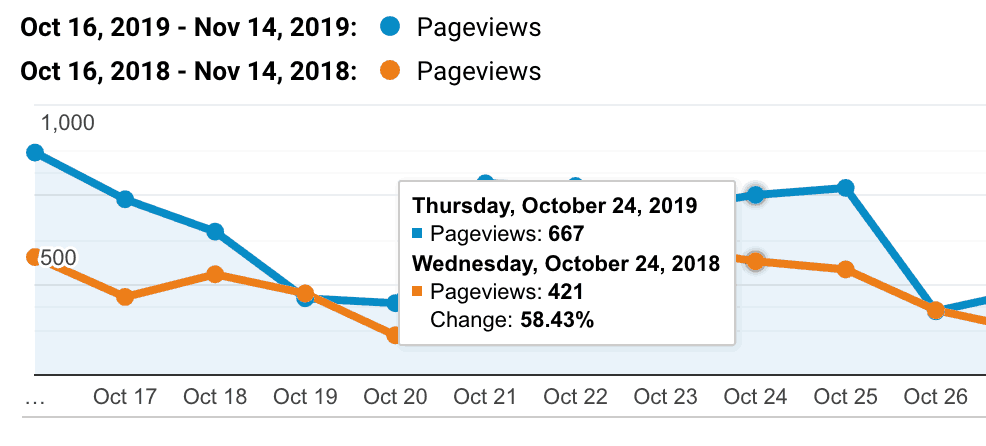
Once you go into the reporting sections within the Dashboard (one the left side of the screen) , keep in mind that you can set the date range you are analyzing. By default, GA will show you the last week, but you can pick custom dates or a number of other options. You can also compare to the same period in the previous year, or the previous period. This is helpful to track how website improvements may be impacting your website traffic.
Reports

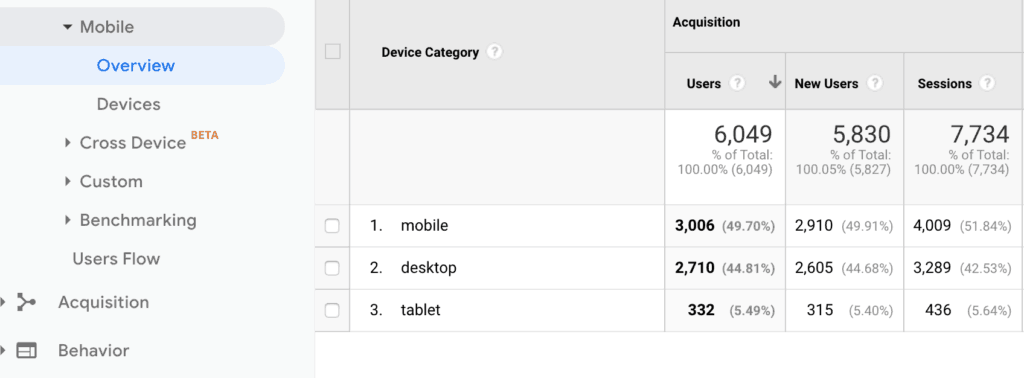
The Audience section contains detailed reports showing your visitors’ age and gender (Demographics), what their general interests are (Interests), where they come from (Geo > Location) and what language they speak (Geo > Language). You can also see how often they visit your website (Behavior), and the technology they use to view your website (Technology and Mobile).
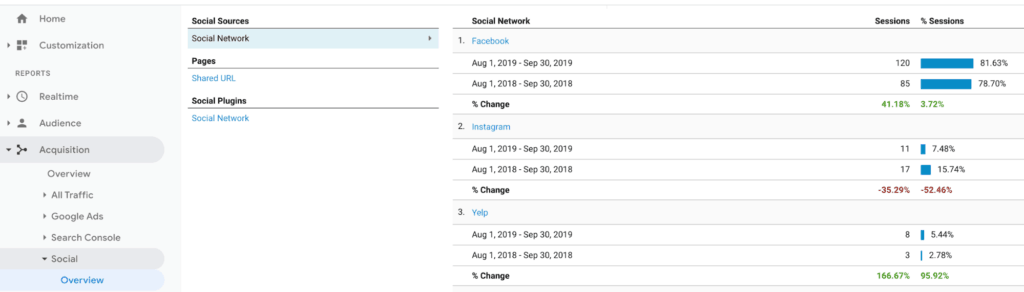
The Acquisition reports section is all about where your traffic is coming from. You can see what drove visitors to your website (All Traffic), as well as data broken down by main categories (All Traffic > Channels) and specific sources (All Traffic > Source/Medium) and Social networks (Social).
If you run Google Ads for your school or program, you can connect GA to AdWords to monitor PPC campaigns. You can also connect GA to Google Search Console to learn more about organic search traffic (SEO).
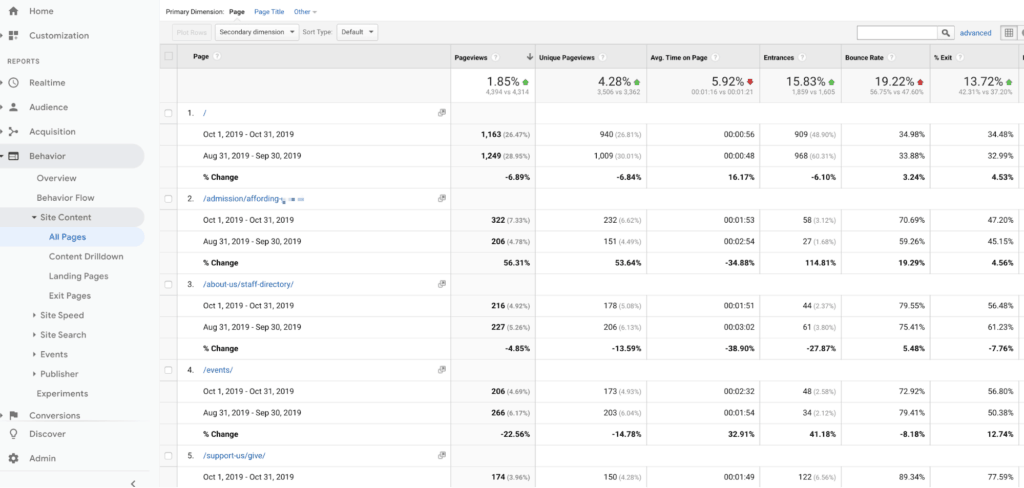
The Behavior section of the Dashboard has a lot of great data about your website content. The Overview page will tell you how many page views your site has received, the average time on a page and the bounce rate. The bounce rate is the percent of single page sessions for which there was no interaction with the page – the rate at which people bounce away from your site. You want to see a low number here.
You can also learn which are the top pages on your website (Site Content > All Pages), the top entry pages on your website (Site Content > Landing Pages), and the top exit pages on your website (Site Content > Exit Pages).
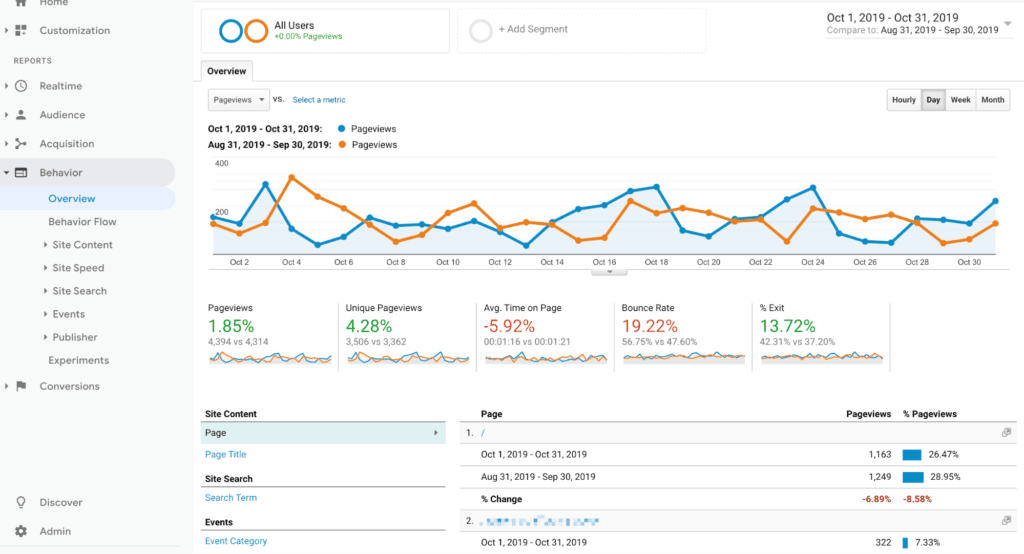
If you hover over the graph, you will see detailed information about that metric on that day:
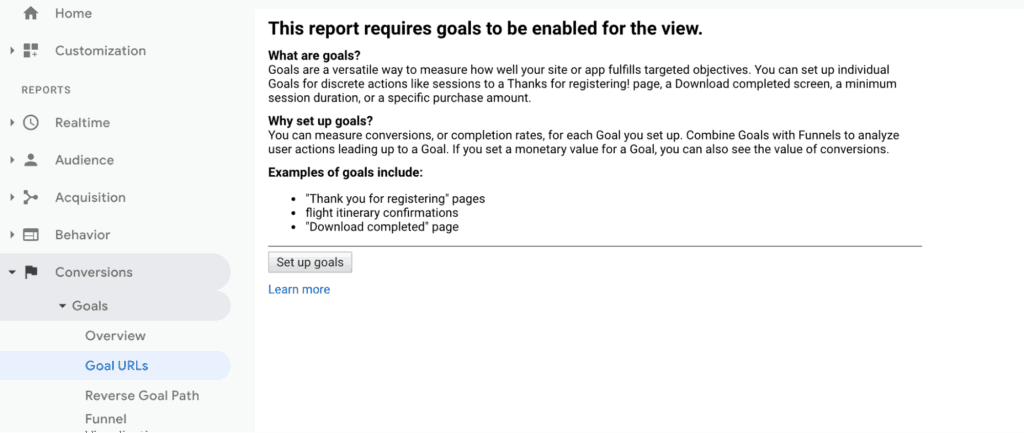
If you want to see what percent of visitors are submitting your contact form (or other actions), you can set up Goals and track conversions. You can see how many conversions your website has received (Goals > Overview) and what URLs they happened upon (Goals > Goal URLs).
Setting up Goals within your Google Analytics is relatively easy to do. Here’s how to create a Goal that tracks the conversion on a preschool application form submission:
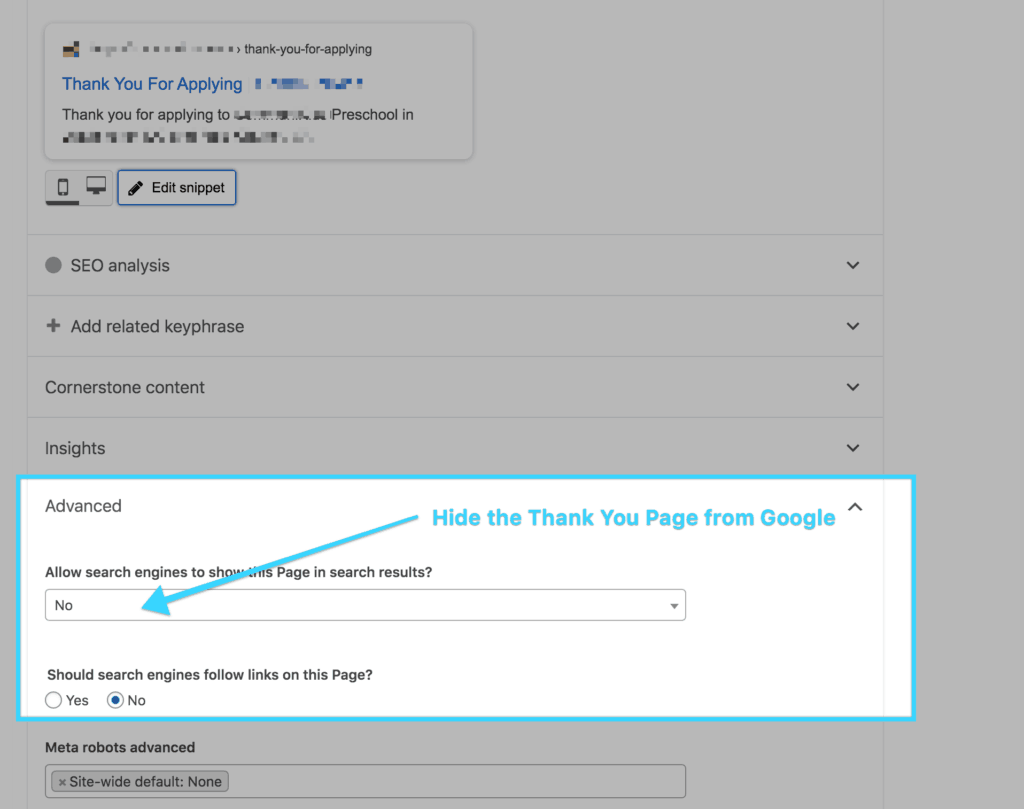
- In order to track conversions, a Thank You page is needed. This page will show after a form has been successfully been submitted (vs. just showing a message on the same page). Hide this page from Google using the “No Index” section in the Yoast SEO WordPress plugin. If you are not using this plugin or WordPress, you will need to hide this page from Google in a file on your server called robots.txt (here’s how to edit your robots.txt file). Hiding the page will help create a more accurate measurement of your goal, since the only way someone can get to the Thank You page should be by submitting an application.

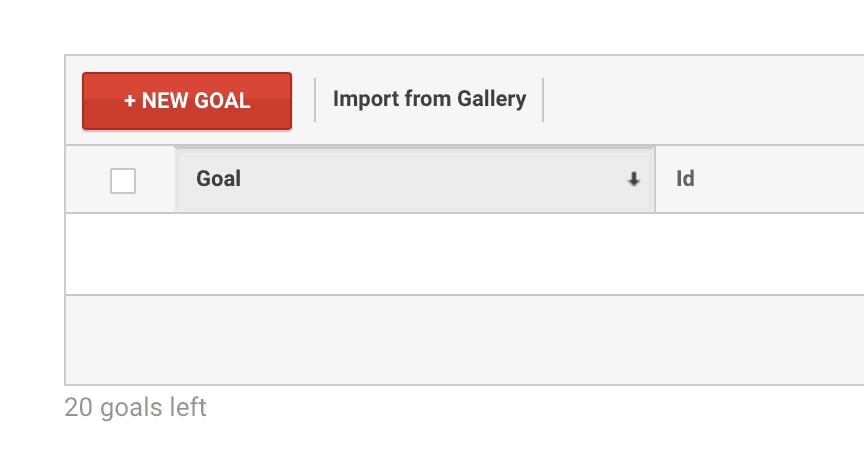
- In Google Analytics, go to Conversions > Goals. Select “Set up goals” and follow the steps below

- Click “New Goal”

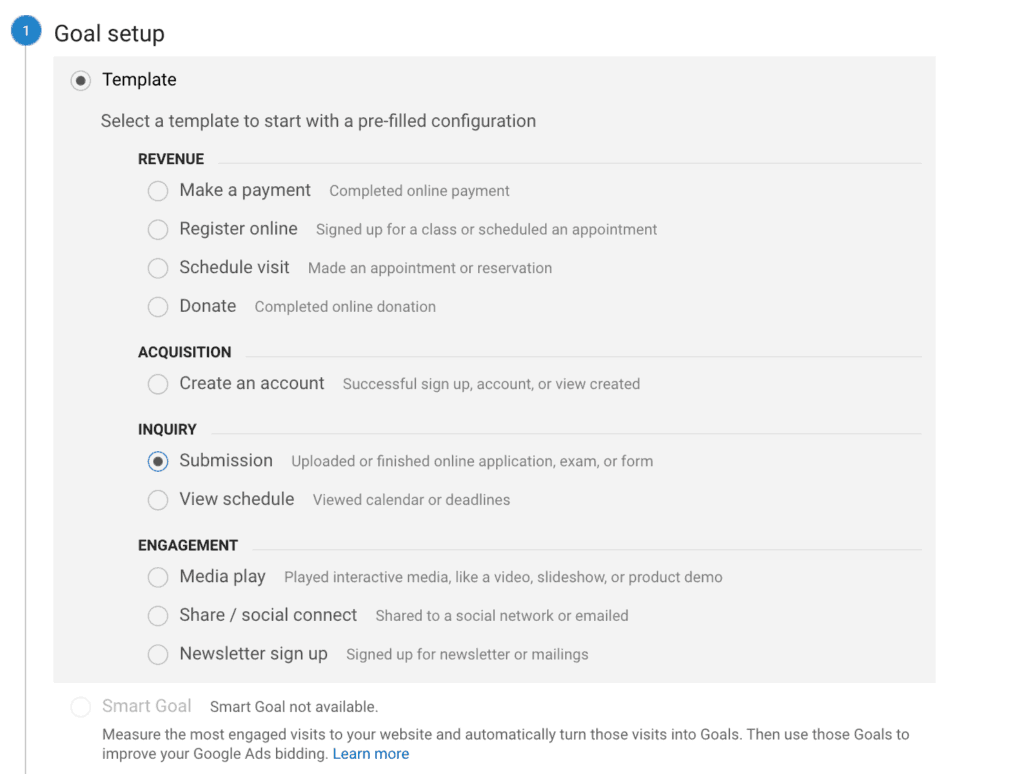
- In the Goal setup section, to measure a form submission, select “Inquiry.”

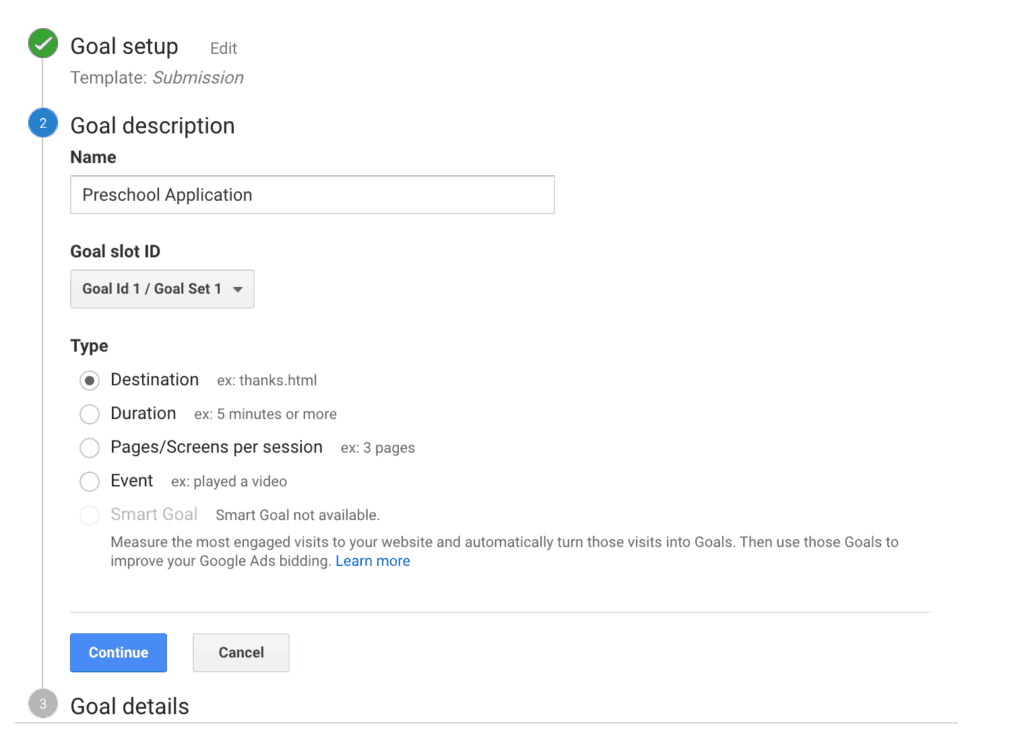
- Next, give your Goal a descriptive name and select “Destination,” since we will be tracking traffic to the Thank You page.

- Finally, in the Goal details section, enter the url of your Thank You page:

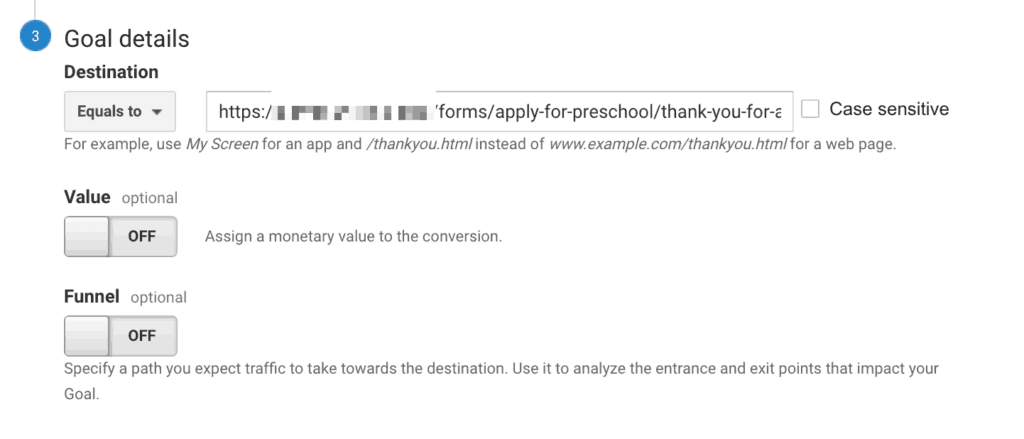
This will help you measure conversion on your website for a form, such as an application.
Using Google Analytics can be overwhelming, but if you know which metrics are available to you, you can decide which data will be helpful in analyzing your school or nonprofit’s website traffic in order to make changes to improve the effectiveness of your website.
We’d love to help you make the most of your website, beginning with an analysis of your GA data. Give your website some TLC today!